PROGRAMINO IDE - Programino serial inline Debugger

 Generate the debug code.
 Start the debugger.
 Continue to Breakpoint until the next breakpoint.
 Stop debugging.
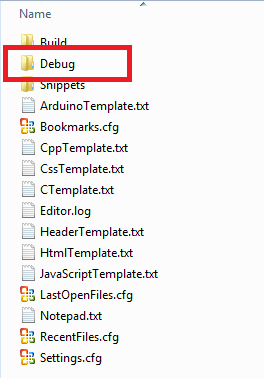
If you press CTRL + SHIFT + W on your keyboard, you can open the path of the debug code.
The Programino IDE debugger for Arduino™ is a powerful and easy to use universal serial inline debugger.
It does not require any additional hardware to use.
The debugger generates its own debug code.
This allows variables (even entire functions or calculations) to be viewed at runtime.
Breakpoints allow the programme to be stopped at desired points and to wait until it is continued by the user.
In this way, errors and programme sequences can be checked quickly.
The annoying insertion of Serial.println() is no longer necessary.
The available debugger functions:
Add Breakpoint: Insert breakpoint in the line of the cursor.
Remove Breakpoint: Remove breakpoint in the line of the cursor.
Remove All Breakpoints: Remove all breakpoints in the file.
Add Debug Variable: Add selected variable.
Remove Debug Variable: Remove the marked variable.
Remove All Debug Variable: Remove all debug variables in the file.
With the help of a small example, you can now see how to use the debugger.
To add a debug variable, do the following:
- Open the example code "\Programino Examples\Debugger".
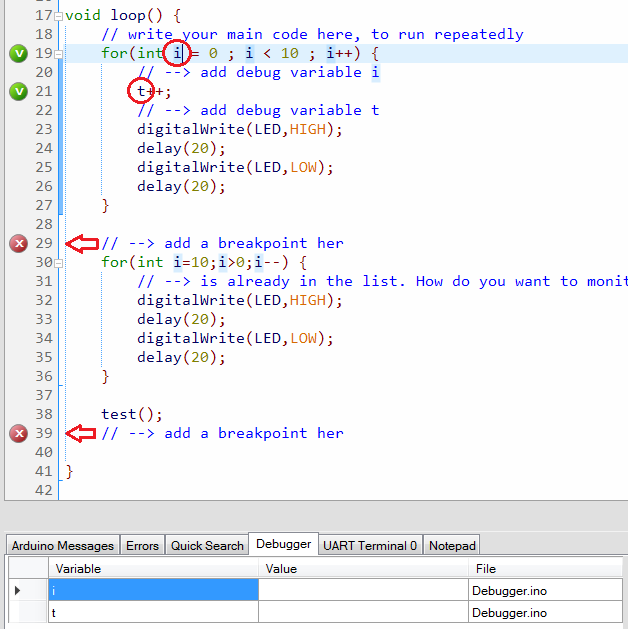
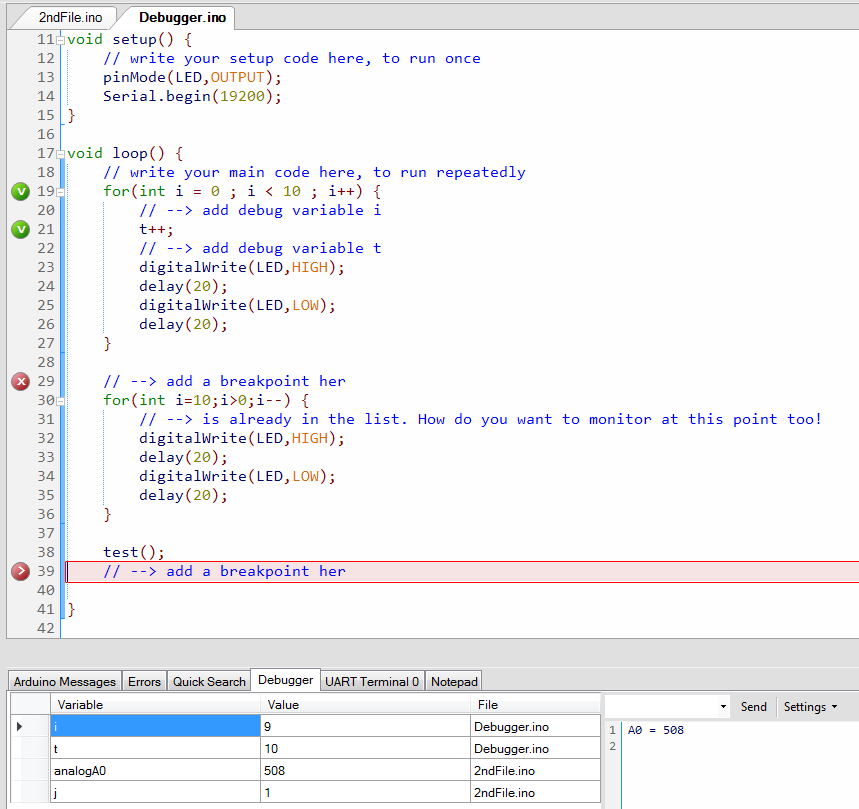
- Click with the mouse at the beginning or the end of the variable (in this example first variable is "i" and the second is "t").
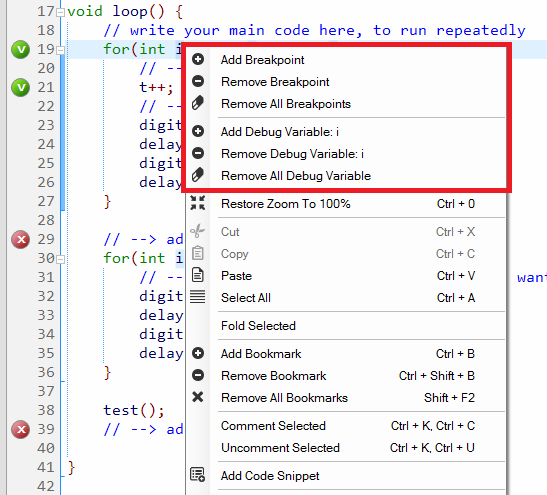
- Press the right mouse button to open the context menu.
- Select "Add Debug Variable:". The marked variable is displayed in the context menu.
- The variable then appears in the Debugger Variables window.
To add a breakpoint, do the following:
- Click with the mouse on the line where the breakpoint is to be inserted.
- Press the right mouse button to open the context menu.
- Select "Add Breakpoint".
- The breakpoint has been set. A red dot with an arrow is displayed at the location of the breakpoint.
Repeat this also in the "2ndFile.ino" of the example as shown in the figure.
Now all variables and breakpoints have been added.
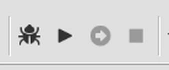
To generate the debug code, press the icon with the "beetle" in the menu above.
The debug code is now generated.
The original code is not changed, the debug code is saved in a separate location!
Generate the debug code. Start the debugger. Continue to Breakpoint until the next breakpoint. Stop debugging.- Make sure your Arduino™ board is connected to the IDE (Board and Comport).
- Generate the debug code.
- After upload the programm to the Arduino™ board, start the programme with the "Play" icon.
- The programme runs to the first breakpoint and stops there.
- To continue, click on the icon with the "arrow to the right".
- The programme continues until the next breakpoint.
- Continue and watch the output until you have reached the very first breakpoint again.
- Now you can end the debugger with the "Stop" icon.
The debugger uses the serial interface for communication.
Outputs with serial.print() are also displayed in the right output window during debugging.
If you press CTRL + SHIFT + W on your keyboard, you can open the path of the debug code.
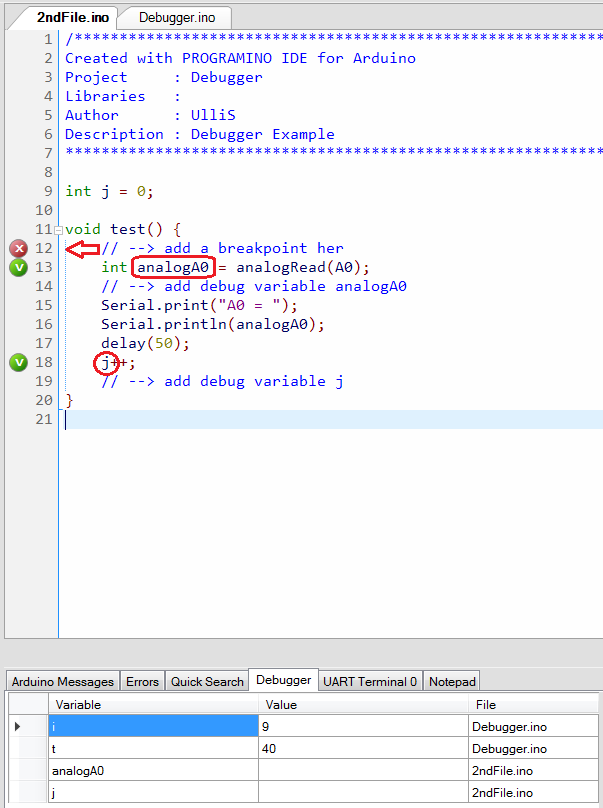
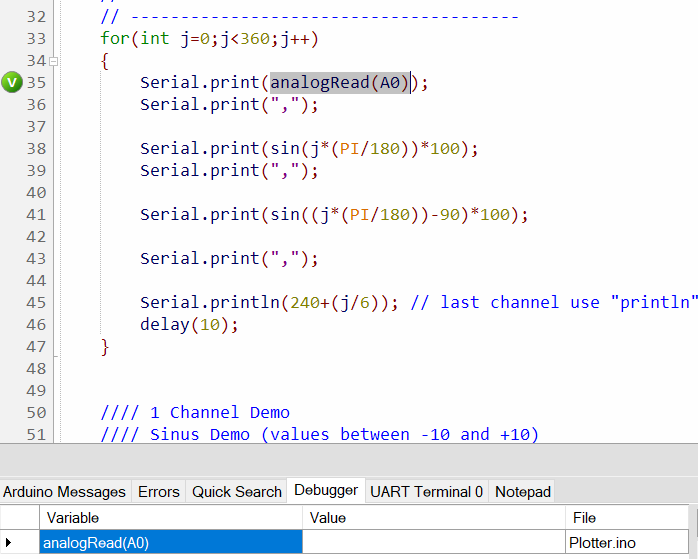
You can also add whole functions or calculations to the debugger output.
To do this, select the area you want to output and add it as a variable. In the example "analogRead(A0)".
Make sure that the brackets are also properly marked!
Debugger example (File and File2):